The UFO Sightings US Heat Map
2011-01-24
For a while now I've been interested in data mining and visualization. When someone posted a link to a dataset of UFO sighting information on Reddit, it seemed as good an opportunity as any to jump in and get my feet wet. There's a lot that could be done with this data, but to start I decided to make a heat map indicating the number of sightings by county, throughout the US.
With the help of this excellent guide over at Flowing Data, this didn't seem too hard at all. The only hiccup was that I needed to determine the county and state from the location field in the data. For the most part, I was able to stitch together data from several other datasets to resolve the city and state format of the location field into the county and state information needed to locate the sighting on the map. Unfortunately, this narrowed down the data from around 63000 sightings to around 43000. For the records where no county and state could be identified, most were either outside the US, or the city name was not connected to a county name in any of the datasets I dug up. Obviously, having a more comprehensive listing of all city names in the US along with the corresponding county in which they reside would be helpful, but working with free data, you take what you can get.
Another confounding factor was that the location field was somewhat noisy and non-uniform. The location might be something like "New York City, NY" (which would be ideal as this could be split on the comma into city and state) or it might say something like "Las Vegas (side of the highway north of town), NV" which fails when simply split on the comma, so even though that particular city and state would be in my data, it wouldn't be identified. I was able to improve the rate at which counties were correctly identified a little by removing all parenthetical remarks, and special-casing any location that already had the word "county" in it.
But anyway, without any further ado. Let's have a look at the map. Click on it for a larger version.
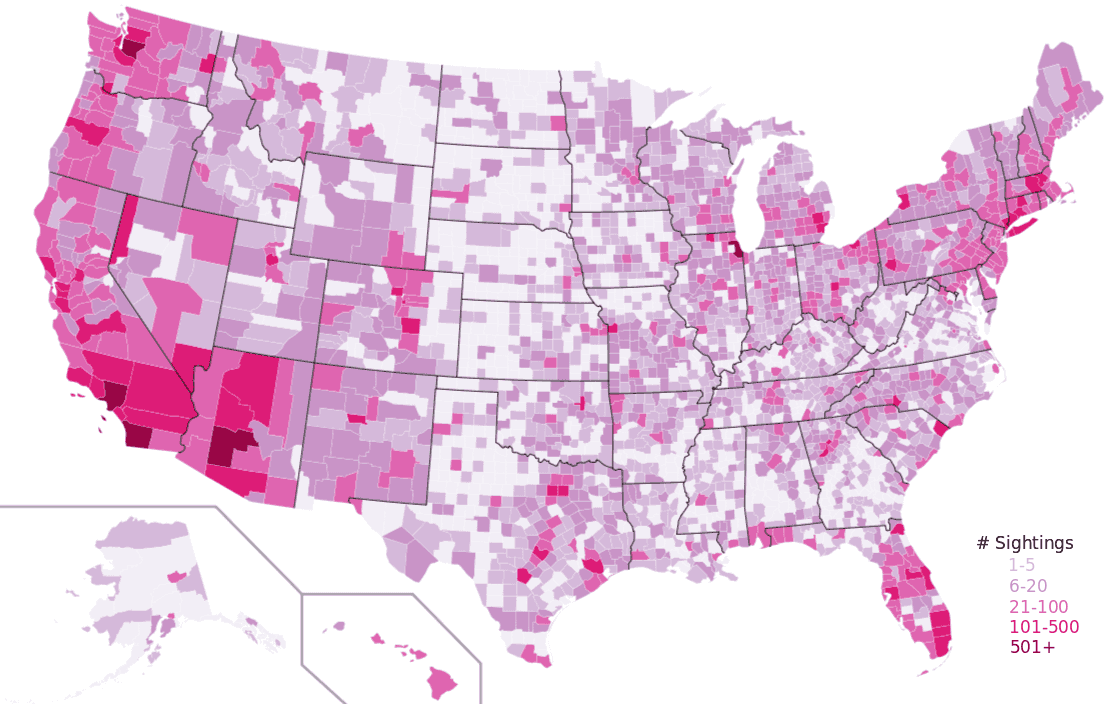
I think one of the more interesting things to note is that the sighting density seems to roughly correlate with population. The stereotypical idea of a UFO sighting, at least in my mind, is of someone all alone on a dark road out in the middle of nowhere, and is also associated with more rural populations. However, it seems like the more people there are are in a given area, the more likely it is, rougly, that some of them have seen, or thought they saw, a UFO.
I think there's a good deal of information to be mined. I'd also like to get around to seeing if there's any particular day of the week or time of year when sightings are more prevalent. Maybe Friday and Saturday nights when people are more likely to have been drinking? It would also be interesting to not if there's any similarities in description based on sightings that take place around the same time, or in the same place.
If you're interested, you can find all the datasets I used to patch together the data for this analysis at the following locations:
UFO Dataset
US towns and zip codes
US county and FIPS code data
Blank USA County map
All county FIPs codes
If you'd like to see the code I used to create the map, it's available on my bitbucket account. The numerical FIPs codes ended up being unnecessary, so it's a little more convoluted than I might like, but it works well enough I suppose.
Originally published 2011-01-24 06:29:01